I’m sure that most, if not all of us, agree that climate
change, due to man-made carbon dioxide from burning fossil fuels, is the single
most serious challenge facing the world today.
July 2021 Eastern Belgium
So what is the best way of tackling the problem of a global rising energy
demand and demand for electricity in particular, at the same time as limiting or
even reducing to zero, the emission of man-made greenhouse gases?
This is a complicated and wide ranging subject and addressing
it has resulted in over 10,000 words so, in order to help its digestibility for
the reader, it has been published in four parts.
In part 2 the need for backup power is
explained when renewable outputs fall and sufficient energy storage is not
available. Various means of storing energy are considered and discussed.
In order to give some background before dealing
with more recent designs in part 4, in this article the most common types of nuclear reactors currently
in service are discussed and their disadvantages highlighted.
The fourth part will expand on the opportunities offered
by some more recent nuclear technologies, for much cheaper and safer nuclear power
from reactors.These also generate much
less waste, or can even burn waste from earlier generations of reactors.
So if reducing to a minimum carbon dioxide emissions from the burning of fossil fuels is necessary to mitigate the effects of climate change, the questions which remain to be settled are how is this to be done and what will replace fossil fuels.
Tricastin nuclear power station and a wind turbine
Whilst we can make some progress within developed economies by improvements in efficiency, conservation and demand management, the net result of these measures will be grossly insufficient to counter increasing global demand arising from the legitimate requirement for more energy from developing economies. In this video “The Magic Washing Machine” by Hans Rosling (now sadly deceased) he explains why we in the developed world have no right to tell people in developing economies that they can’t use more energy because of Climate Change, since it’s a major key to lifting poor people out of poverty.
The role of renewables So as well as conservation measures what is the best way forward? Clearly renewables have a significant part to play in the future of energy production, and they are getting cheaper, but many are still being subsidized and, in common with other energy production technologies, they are not without an impact on the environment. Global primary energy by source Primary energy is an energy form found in nature that has not been subjected to any human engineered conversion process. It is energy contained in raw fuels, and other forms of energy received as inputs to a system. Primary energy can be non-renewable or renewable. Where primary energy is used to describe fossil fuels, the embodied energy of the fuel is available as thermal energy and around 70% is typically lost in conversion to electrical or mechanical energy. There is a similar 60-80% conversion loss when solar and wind energy is converted to electricity, but today's UN conventions on energy statistics counts the electricity made from wind and solar as the primary energy itself for these sources.
The following graphic shows the global primary energy consumed for all purposes including electricity generation. Energy generated from nuclear, hydropower, biomass and other renewables is directly measured as electricity outputs whilst coal, oil and gas need efficiency factors to be applied when they are used for electricity generation, as opposed to industrial process heat or to power vehicles. The vertical axis is in Mega Tonnes of Oil Equivalent Mtoe.
The proportion of carbon free energy i.e. renewables, biomass, hydro and nuclear, is projected in 2030 to be only 20.5% of total primary energy consumed. So, to replace the other 79.5% of primary energy from fossil fuels, an enormous investment in energy from carbon free sources, of all types, is therefore required to meet decarbonization targets and it was needed yesterday!
Biofuels Except in particular locations bio-fuels are heavy consumers of agricultural land and are unlikely to provide more than marginal amounts of electricity on a global scale but they have a role to play. In Brazil, for example, they are successfully replacing fossil fuels for vehicles with blends of gasoline and ethanol derived from sugar cane. Biodiesel, in various blends, is established in North America and Europe. Biofuels are being encouraged by the EU, but there are concerns that by displacing food production from agricultural land and clearing forests, which are net absorbers of CO2, the production of biofuels could actually release more carbon dioxide than they save.
Tidal power Tidal power could also contribute more to renewable energy production, and some sites have been in operation since the 1960's. Tidal power generation is, of course, very predictable and could remove much of the need for back up fossil fuel generation for other less predictable renewables, but tidal barrages and lagoons have an impact on ecosystems and the energy generated is on a lunar cycle, which does not coincide with diurnal demand.
Submerged tidal turbines Submerged turbines placed in locations where currents are created by tidal flows are another possible source of tidal power. Studies are ongoing but environmental impacts are likely to be much less than tidal barrages. Wave power
Wave power is a source of renewable energy which could be further developed and wave farms have been installed in a number of coastal locations. Currently the largest operational wave farm has a capacity of 2.4MW and most are in the fraction of a MW range. The graphic below shows the potential in terms of kW/m for the world's oceans and it’s clear that some locations, such as the North Atlantic and Northern Pacific are potentially much more productive than others.
Hydro-electricity Hydro electricity has, along with nuclear and wind, one of the lowest rates of carbon dioxide generated at 18.5g CO2 per kWh. What’s more it is dispatchable power which can be rapidly varied to suit the demand and compensate for variable generation from wind and solar PV. It’s therefore an attractive investment for governments to make.
Hydropower in Europe
As of 2020 in Europe there were:-
254 GW of installed generation capacity, 55 GW of pumped storage capacity and 676 TWh of electricity were generated in the year representing 13% of total European electricity generation.
During the year 2020, 3GW of capacity were added across the European region, made up mainly by new hydropower plants commissioned in Turkey and other additions in Norway and Albania. Generation from hydropower was almost 4 per cent higher in 2020 than the previous year, owing largely to increased production in the Nordics and Iberia.
Adding major amounts of capacity in Europe involves damming rivers and creating lakes and because there are few “natural habitat-rich” rivers left, this is controversial and unpopular with some environmentalists.
Hydropower internationally Installed global hydropower capacity rose by 1.6 per cent to 1,330 gigawatts (GW) over the past year 2020 and generated a record 4,370 terawatt hours (TWh) or 19% of world consumption.
During 2020, hydropower projects totalling 21 GW were put into operation, up on 2019’s 15.6 GW. Nearly two-thirds of this growth came from China, which saw 13.8 GW of new capacity. Among other countries that added new capacity, only Turkey (2.5 GW) contributed more than 1 GW.
Wudongde in operation
The single biggest project was Wudongde in China, which put eight of its 12 units online, adding 6.8 GW to the Chinese grid. The remainder are expected to be commissioned in 2021.
China remains the world leader in respect of total hydropower installed capacity with over 370 GW. Brazil (109 GW), the USA (102 GW), Canada (82 GW) and India (50 GW) make up the rest of the top five. Japan and Russia are just behind India, followed by Norway (33 GW) and Turkey (31 GW).
Nevertheless the International Hydropower Association in their 2021 Status Report states that much faster growth is necessary:
Quote <<to limit dangerous global warming and achieve net zero by 2050, the International Energy Agency (IEA), however, says the water power sector will need to double in size to 2,600 GW. This equates to building the same amount of capacity in the next 30 years as was built in the last 100 years.
“At the present rate of hydropower development, the global energy pathway to net zero emissions will not be realised,” warn IHA President Roger Gill and IHA Chief Executive Eddie Rich in the report’s foreword. “This is a wake-up call for policy-makers, hydropower developers and project financiers and provides clarity for the public.
“Investment in sustainably developed and responsibly operated hydropower is essential to support the massive expansion of variable renewables like wind and solar. However annual growth rates of 1.5 to 2 per cent cannot meet the doubling of installed capacity proposed by the International Energy Agency to achieve net zero by 2050.”
According to the report, the Covid-19 crisis has further underlined how the power system flexibility provided by hydropower is now a prerequisite for the clean energy transition. Hydropower’s critical role was illustrated by a recent near blackout incident in Europe in January 2021. >> Unquote.
The emphasis on using hydropower, which is quickly increased or reduced, to support grid power systems having an increasing proportion of variable renewables is enlightening and significant.
Geothermal There are geothermal power installations of 10MW capacity or more on 72 sites in 16 countries with a total installed electrical output capacity of 10.9 GW. This is proven technology which has been in operation for decades and the total output is equivalent to about 18 typical coal fired power stations. There are almost certainly more opportunities to expand the output of geothermal power and, as carbon reduction policies begin to harden, more plants will be built, but on a worldwide scale its contribution to reducing fossil fuel use will not be very significant.
Wind Wind power has expanded rapidly in recent years and in 2020 reached 743 GW of installed capacity worldwide.
Quoting from the Global Wind Energy Council, << 2020 was the best year in history for the global wind industry with 93 GW of new capacity installed – a 53 per cent year-on-year increase – but this growth is not sufficient to ensure the world achieves net zero by 2050. The world needs to be installing wind power three times faster over the next decade in order to stay on a net zero pathway and avoid the worst impacts of climate change.....
......Today, there is now 743 GW of wind power capacity worldwide, helping to avoid over 1.1 billion tonnes of CO2 globally – equivalent to the annual carbon emissions of South America.
Yet, as the clean energy technology with the most decarbonization potential per MW, the report shows that the current rate of wind power deployment will not be enough to achieve carbon neutrality by the middle of this century, and urgent action must be taken by policymakers now to scale up wind power at the necessary pace.>> Unquote.
There is, however, an element of misleading “sales talk” in these figures. The capacity factor of a wind turbine is its average power output divided by its maximum power capacity. On land, capacity factors range from 0.26 to 0.52. In the U.S. the fleet wide average capacity factor was 35%, so applying this to the global total of 743 GW would give an equivalent electrical output of only 260 GW or about a third of the installed capacity.
Whilst one can understand the Global Wind Energy Council’s enthusiasm for their technology, it would be better for them to be more honest and realistic, and to quote the total energy generated as TeraWatthours (TWh) instead of talking up generation capacity! As a result one has to question their calculations in general and specifically their assumption that wind power is the only option. They also make no reference to its variability and the need to have backup generation available when wind power reduces unexpectedly.
Nevertheless, on an international scale, one can expect wind power to represent a larger and growing proportion of energy supplies.
Solar Photo-Voltaic
Power generation from solar photo-voltaic globally is estimated to have increased by 22% in 2019, to 720 TWh. With this increase, the solar PV share in global electricity generation is now almost 3%. In 2019, PV generation overtook bio-energy and is now the third-largest renewable electricity technology after hydropower and onshore wind.Solar PV generation rose by 22% in 2019
<< Solar PV electricity generation increased by 131 TWh globally in 2019, to account for 2.7% of the electricity supply. This growth was significantly lower than in 2018, however, because global solar PV capacity additions stalled in 2018 and China’s deployment further contracted in 2019.
From left to right solar PV additions - years 2017-2019
In China, solar PV capacity additions slowed for the second year in row to 30.1 GW in 2019. This expansion is significantly lower than the 53.1 GW in 2017, when the government phased out feed-in tariffs and introduced deployment quotas (in June 2018) to control costs and tackle grid integration challenges. Overall, this policy shift is expected to make solar PV technology more cost-competitive within and outside China, leading to more sustainable development over the longer term. A large number of subsidy-free projects were already in development in multiple provinces in 2019.
Solar PV generation rose sharply in Southeast Asia, driven by a surge in new capacity in Viet Nam from 0.1 GW to 5.4 GW. Capacity additions increased in the United States, the European Union, Latin America, the Middle East and Africa, which together compensated for the slowdown in China, resulting in a record year for PV deployment – 109 GW were installed in 2019.
Solar PV is well on track to reach the Sustainable Development Scenario (SDS) level by 2030, which will require electricity generation from solar PV to increase 15% annually, from 720 TWh in 2019 to almost 3 300 TWh in 2030.>> Unquote.
Land area Electricity generation from wind and solar energy is based on diffuse energy sources and on-shore based wind power is consequently land hungry. The graphic below illustrates the areas required for different energy generating sources for a capacity of 1000MW (1GW). The units are in square miles. To generate 1GW from wind would require about 300 square miles and from solar about 60 square miles.
In contrast fossil fuel power plants, and those using nuclear energy, are burning energy dense substances and so require only about 1 square mile. In terms of area, a gas fired plant would be comparable with a nuclear power station and a coal fired plant would be a little bigger due to the space required for stockpiling coal and ash. In Europe, where most non-urban land is already farmed, I question the overall viability and acceptability of covering fields with solar panels. Near us, in South West France, someone has done just that on an area of land that we used to visit each spring to hear nightingales and look at orchids.
Offshore wind Offshore wind turbines like the Dogger Bank, Wind Farm in the North Sea, have the advantage of not requiring land which could be used for other purposes although, as is reported from the USA, conflicts with fishing industries due to the presence of underground cables are likely.
Offshore wind turbines cost twice as much to install but they are also are more productive since there's almost always more wind off-shore than on land. It follows that countries with long coast lines in comparison with their land area, like the UK, are favourably placed to benefit from off-shore wind power but other countries, don’t have the same opportunities.
Floating turbines would be able to take advantage of the higher wind velocities further out to sea if they are able to overcome disadvantages due to cost.
The energy transition and mineral realities
There
are other real problems with the model currently being pursued by governments
to achieve the transition to sustainable carbon emission free energy.
Wind turbines, solar photo-voltaic and electric vehicles all need minerals, like
lithium and rare earth metals, which require mining and processing with their
associated environmental and energy costs. This often overlooked aspect of the rapid
expansion of the production of these materials is dealt with in detail by Mark
Mills in this well researched video.
Variability of wind and solar Wind power installations are normally expected to produce electricity 30-50% of the time depending on their location, but output is variable over both short and long term timescales.
The daily mean wind power output for Great Britain during the summer of 2018. based on data from www.gridwatch.templar.co.uk
The variability of energy production by location can be an advantage since, if the grid network is sufficiently extensive, having installations in a diversity of locations can result in a degree of smoothing of output power levels.
On dull overcast days, however, solar photovoltaic (PV) power can be largely unproductive, especially in northern latitudes. So when demand peaks on cold winter evenings when there is no sunlight, if there is also no wind, these sources will not supply power.
Solar photovoltaic panels produce most efficiently in hot sunny places, like sparsely inhabited deserts. In certain places, if geo-political constraints involving distance and international borders can be overcome, it may be an economic proposition to generate solar power in one country and transfer it to another. Long transmission lines, with their associated costs and losses (in the USA in 2007 transmission losses were estimated at 6.5%), would then be needed to deliver the power to centres of population.
High Voltage DC lines have been used in some long distance situations. These have the advantage that the capacitance of the line and hence its charging current is no longer a length limiting consideration as it is with alternating current systems. One of the disadvantages is that DC voltages cannot be easily reduced by transformers without first utilizing inverters, with their associated costs and efficiencies, to recreate alternating current.
Dispatchable power So both solar and wind power are, by their nature, highly variable and rarely provide continuous reliable output. In almost all electricity supply grids at present there is no significant storage capacity so, to meet the varying demand from consumers, electricity utility operators therefore have to schedule the right mix of flexible and inflexible power generation capacity from different types of generators. As part of the day to day management of the grid, this requires them to predict the weather conditions and hence the output from renewables. If there is an unpredictable drop in output from renewables, then flexible generation capacity must be very quickly brought on line. Electricity from flexible sources, known as “dispatchable power”, commands a much higher price in wholesale electricity markets than that from inflexible base load plants, so getting this right is therefore important for both utility companies and consumers. This paper from the US National Renewable Energy Laboratory explains the problem in detail.
If, as in Germany, there's a law forcing utilities to accept energy from renewables as a priority then, as the proportion of total generating capacity that wind and solar power provide increases, there will be an increasing need to maintain backup power supplies, in the form of spinning reserves, with their associated costs and energy consumption. If not the system would become unstable and power cuts would result.
The energy transition and mineral supply
There are other real problems with the model currently being pursued by governments to achieve the transition to sustainable carbon emission free energy. Wind turbines and solar photo-voltaic both incorporate minerals and energy for their manufacture as do lithium ion batteries. The expansion of supply necessary to satisfy the demand created by a rapid transition to these technologies will require enormous increases in mining and processing with their associated environmental and energy costs. This video by Mark Mills gives a detailed examination of this often overlooked aspect of the energy transition.
Grid scale energy storage In effect, without grid scale energy storage, to satisfy the demand when renewables can't, there will be a limit to the overall proportion of electricity production that can be provided by these non-dispatchable sources. At present grid scale storage is minimal so gas fired turbines are kept spinning at low power, in anticipation of a requirement for bringing higher outputs on line very rapidly.
The next article will deal with some of the many and varied ways of storing energy.
In Part 1 - The Role of Renewable Energy, I discussed various options for low carbon, or carbon free, energy generation. I concluded that, unless grid-scale energy storage is available, the variability of the most rapidly expanding renewable energy sources, i.e. wind and solar PV, limits their penetration into electricity generation and distribution systems. So what options are available for large scale energy storage?
There are many ways of storing and recovering energy. For electricity the one we are most familiar with is the use of batteries.
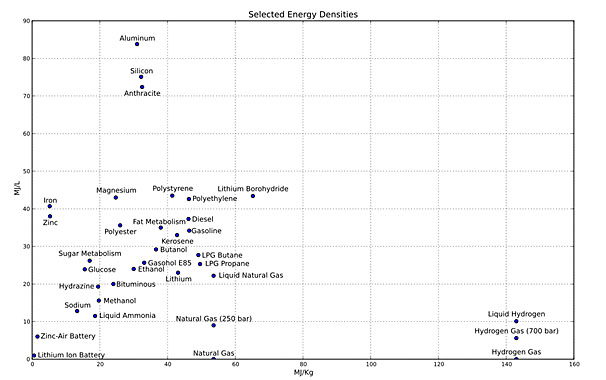
Battery storage The following graphic, which plots energy density in MJoules/litre against MJoules/kg, puts into context the energy density of Lithium Ion and Zinc-Air batteries relative to other substances. The significance of energy density is that gasoline, for example, effectively stores about 50 times more energy per kg than lithium ion batteries and so is a much more portable energy source. This is important for powering aircraft and heavy vehicles.
As a result of its use in electric vehicles, battery storage technology is developing and getting cheaper; but currently batteries are still expensive, have low energy densities and a limited life. In addition as the demand for batteries increases there will be issues to face regarding the price and availability of the minerals which they need for their manufacture. According to Mark Mills in the video above (30:20) changes to the battery chemistry will not fundamentally improve this situation.
In my view both energy density and longevity would need to improve significantly before the use of batteries to smooth out variable production from renewables on time scales, of say 4 to 12 hours or more, would become economic on a grid scale. There are, nonetheless, many battery storage schemes planned or under construction in the US and internationally.
The planned UK scheme at London Gateway, Thurrock, Essex has a peak output of 320MW and a storage capacity of 640MWh. Thus, if the batteries can tolerate 100% discharges, it has a theoretical run time at maximum output of 2 hours but it’s difficult to know what proportion of connected demand this represents.
Compare this to the proposed 3.6GW Dogger Bank Wind Farm in the North Sea, which is being developed in three phases of 1.2GW each, and it’s clear that Battery Storage projects are a long way from acting as medium term backups to Wind Power Generation. (A Gigawatt is 1,000 Megawats).
There is also a 185 MWh battery installation in operation, the Hornsdale Power Reserve, in South Australia, which has a full output rated at 150 MW. This installation is used for frequency and voltage stabilisation and is very fast acting, being able to put power into the grid in milliseconds, and thus smooth out shocks and transients caused by generation blips and load switching. Using the equipment to support electricity supplies in this way has generated significant savings by driving down the cost of providing fast despatchable power, which is otherwise expensive due to the need to run fossil fuel generators in standby mode. Australia’s electricity supply is heavily dependent on coal fired power stations and it remains to be seen whether the use of renewables like wind or solar, combined with battery storage, can be competitive or even politically palatable.
What can be confidently said is that battery storage is going to become more and more important in supporting supply grids with a high penetration of variable renewables in the future.
Energy storage in molten salt By heating up a salt until it’s molten, energy can be stored in tanks of the hot liquid salt for later recovery by power generation systems. This has been done on the full scale in several solar power plants using directed mirrors in the USA, Spain, and China.
Andasol solar power plant, Spain
It’s also proposed as an adjunct to high temperature reactors such as the Moltex SSR with GridReserve® and the TerraPower Natrium reactor, so that the stored heat can be used to run generators and provide peak power outputs when required.
Other types of energy storage Other energy storage systems are being proposed and investigated, and some may be promising in the long term, but most are not yet proven to be economically viable or available for widespread deployment. Some of them are discussed below.
Generation of hydrogen An interesting example is the proposal to use surplus energy generated by wind and solar, when it’s not required by the grid, to produce hydrogen by electrolysis which can be compressed and stored until it’s used: either to blend into natural gas distribution networks, or to power vehicles and aircraft, or to generate electricity during periods of low output from renewables.
The disadvantage with these concepts is their overall efficiency. For example the efficiency of electrolysis is currently 60-70% and the ongoing conversion back into electricity is 40-60% (depending on the method used). Thus the overall efficiency of the round trip is 24-56%, which is much lower than batteries, and there is also the energy cost of compressing the gas for storage but, providing there are periods of overcapacity of installed renewable electricity generation, the electricity used is effectively free.
Work is ongoing to establish the overall economic viability of hydrogen generation and storage.
Some boiler manufacturers like the UK company Worcester-Bosch are conducting long term research to determine the viability of using hydrogen blended with natural gas in a domestic setting. They have found that blends of up to 20% hydrogen require only minor changes to natural gas boilers.
Hydrogen can cause embrittlement of metals and some types of steel used for high pressure gas distribution pipelines may need to be lined or replaced depending on the steel used. Pipelines made from cast iron, polyethylene and elastomeric polymers are unaffected and so the operators of domestic networks are not at risk of major expenditure.
A further method which is getting serious consideration and development is the use of liquid air as an energy storage medium. Similarly to the production of hydrogen, electricity production from wind and solar would be used to liquefy air at atmospheric pressure and when required it can be evaporated under pressure to drive generators.
A 5MW/15MWh demonstration plant, constructed by Highview Power, has been in operation since 2018 at Pilsworth, Bury, UK. Construction has started on an £85m project at Trafford Energy Park, Manchester, UK, which is due for completion in 2022 and will store 250 MWh of energy. The round trip efficiency of such systems is low at around 25% but this can be enhanced, with the use of a cold store, to 50%. If the facility is located near a source of waste heat like an industrial process or thermal power generation system, the efficiency can be further enhanced, and Highview Power claims 70%, without the need to augment the capital cost with heat recovery systems.
Electric vehicles Another idea is that, when required, electricity could be fed back into the grid from the batteries in electric vehicles: and therefore at some future date a large battery storage capacity would be available to smooth out shortfalls between generating capacity and demand. Although this Vehicle to Grid concept is now being marketed by Nissan and Ovo, it's unclear how it would be managed on a large scale, but it would probably need an infrastructure that had connection points at the majority of parking places; as well as some form of smart metering that credited the vehicle owner if stored electricity, that had already been paid for, was drawn out of the vehicle's batteries. These connection points, or the vehicles themselves, would also need to be equipped with inverters capable of converting DC battery current into AC power and synchronizing it with the grid. This concept has the attractive characteristic that the extra cost of adding these facilities to the charging infrastructure or the vehicles themselves is marginal.
The transition to electric vehicles, which is happening at a surprisingly fast rate, will make a contribution to the reduction in greenhouse gases from burning hydrocarbon fuels. Even if the electricity to charge vehicle batteries comes from gas-fired power stations there will be some efficiency savings and hence overall less carbon dioxide and nitrogen oxides will be discharged to the atmosphere.
But the requirement to charge an ever growing fleet of electric vehicles will put an increasing burden on the electricity supply network. So, without making any allowances for the higher efficiency of electricity versus gasoline when powering vehicles, for the UK I calculate this will require 7 new power stations to be built each year over the next twenty years.
If anyone feels like checking this calculation they’re welcome!
Pumped hydro
One system that has been proved to be viable for energy storage is pumped hydroelectricity, which has had plants in operation for decades. They require two large lakes, one several hundreds of metres above the other.
Water is pumped up when electricity costs are low and released through turbines to generate electricity when required. Due to pump/turbine efficiencies and the two way conversion, the electricity recovered is only about 70-80% of the electricity input. The geographical opportunities for such installations are few, and so far they have only been used for providing flexible power for relatively short durations at peak times when the feed-in tariff for electricity is high.
Backup power Backup power production capacity or energy storage is therefore necessary to supply the demand for energy when wind and solar can’t and, because it takes time to bring generating capacity on line, some backup systems have to be kept running even when the demand is being satisfied by renewables.
The German experiment Under the German EnergieWende, in which it’s intended to move away from fossil fuels and nuclear power to a low-carbon energy economy, up to 2014 they have been running lignite and hard coal fired power plants to replace the energy generated by nuclear plants which have been taken out of service, and to provide backup to wind and solar. During these years the consumption of gas has also been reduced: so the increase in energy from renewable sources has been offset by the reduction in the least carbon dioxide producing sources i.e. nuclear and gas.
The following graphic shows German energy consumption updated to 2019 and corrected for efficiency.
This means that the vertical axis depicts the amount of primary energy required to generate the indicated amount of TeraWatt hours of electricity.
Since 2014 the proportion of coal and nuclear electricity generation has decreased, that of gas and oil has stayed the same, whilst wind power has on the other hand increased. So far so good, but it’s clear that the total output from renewables has a long way to go before it represents a significant proportion of total generation capacity. Furthermore if electricity production is ever to be carbon free then the consumption of oil, coal and gas needs to be reduced to zero.
Coal is the most polluting fuel Coal, and particularly lignite, is the most polluting of all the fuel options since, due to lower efficiencies, legacy plants produce more carbon dioxide per MWh than other fossil fuels and release, into the environment pollutants: including particulates; sulphur and nitrogen oxides; and ash. Ash contains uranium and is 100 times more radioactive than nuclear waste. It also contains heavy metals which will never decay and become less polluting. This ash is typically dumped or stockpiled with minimal control and has caused serious ash-slides necessitating dangerous clean up work.
Air pollution from burning coal is even more serious because it travels further. If, like me you are old enough, you may remember the acid rain arising from UK coal burning power stations that acidified Scandinavian lakes in the 1980's.
The horrific air pollution in China also dramatically illustrates the results of burning coal and is responsible for many premature deaths.
Germany has passed a law intended to phase out coal fired power stations by 2038. This will commit Germany to closing all of its coal and lignite fired power stations, but it will clearly be very difficult to phase out both nuclear and coal fired generation, which together represent more than 50% of current capacity, and replace them with intermittent renewables. It’s not clear how Germany intends to fill the gap that it appears likely to create without a change of policy but it will probably be plugged by burning Russian gas. In effect the German EnergieWende amounts to an experiment on a national scale.
You can be paid for using electricity! Another effect of relying more and more on renewables has occurred in Germany on some sunny and windy days. Because German law forces their grid operators to accept renewable energy in preference to that from fossil fuels, and electricity production from fossil fuels cannot easily be ramped down, on occasions the price of electricity has become negative in response to an over-supply, meaning that commercial consumers are being paid to burn more electricity!
It’s clear that this is a ludicrous waste of an otherwise precious resource that results in some measure from subsidies and, apart from providing windfalls to large industrial users who are able to ramp up their energy consumption, it has no advantages. This energy should be used for other purposes which are viable without continuous power, such as, perhaps, generating hydrogen for storage.
Renewable power alone is not the exclusive answer My conclusion is that, over any specific 24 hour period, renewables can only satisfy a proportion of the total energy demand on any supply grid and a mix of different generation sources and storage types is necessary,
The next article, Part 3 Nuclear Power and the Reduction of Carbon Dioxide Emissions, advocates the use of nuclear power to secure the base load when wind and solar can’t.
To enable the reader to contrast the technology of the current fleet of 2nd generation nuclear reactors constructed in the 1960’s and 70’s with the more recent and safer designs, that are explained in part 4 of this series, the next article goes on to describe what second generation nuclear reactors contain and how they work.
In the previous article I concluded that intermittent renewable energy sources, like wind and solar PV, will not be sufficiently reliable to fully replace fossil fuels. Furthermore, even with an installed overcapacity of such sources, energy storage options are insufficiently developed to power electricity supply grids during periods of low renewable energy production and, if nuclear generation is ruled out, fossil fuel powered backup generating stations will be required.
Ross Koningstein and David Fork are engineers at Google who worked together between 2007 and 2011 on the renewable energy initiative somewhat geekily known as RE<C". From a position of strongly supporting renewables as the answer to the climate crisis, and following modelling studies, they came to the view that renewables alone would be insufficient to address the requirement for enough carbon free energy to halt the increase in atmospheric carbon dioxide. “As we reflected on the project, we came to the conclusion that even if Google and others had led the way toward a wholesale adoption of renewable energy, that switch would not have resulted in significant reductions of carbon dioxide emissions," wrote Koningstein and Fork.”
So what would it really take to limit or even reverse climate change if today's renewable technologies by themselves aren't enough?
Koningstein's and Fork's research led them to think that a new technology is required, which will disrupt the existing status quo, but beyond discussing smarter, distributed, small scale power generation, they didn’t specify which technology, or deal with the need to act now and not wait in the hope that something new will emerge.
Environmentalists for nuclear and renewables Taking into account the variability of wind and solar, and the current status of energy storage technologies, I've come to the conclusion that, alongside renewables, the only energy production technology that is available to be deployed on a global scale over the next twenty to thirty years, which will not contribute to climate change, is nuclear power.
Other environmentalists also expand on their reasons for changing their view of nuclear power in this video.
So, together with a growing community of engineers, scientists and environmental campaigners, I am proposing nuclear power alongside renewables as the future for reducing carbon dioxide emissions and slowing the increase of the atmospheric concentration of greenhouse gases.
The example of France As a result of the 1973 Oil Crisis, and its lack of natural fossil fuel resources, France decided, on the grounds of energy security, to rapidly expand its fleet of nuclear reactors and most of the plants currently in operation were built in the 70’s and 80’s. There are at present 56 active power reactors and, over the 30 years between 1990 and 2019, nuclear power generation has saved around 49 million tonnes of carbon dioxide from being discharged to the atmosphere. France exports electricity to nearly all its neighbours and earns €3 billion per year from this.
I quote this example to illustrate that a major change of technology can be implemented in a relatively short time, with highly effective results.
What does a nuclear power station contain? Since, however, not many people have studied nuclear technologies; I will take the liberty of briefly explaining how reactors work and the degree of diversity of designs that have been built.
The primary components of any nuclear power generation system are the following;
· A critical mass of fissile material; · A containment structure; · A power supply and control system; · A cooling/heat transfer loop; · A power generation system (a means of turning the heat into electrical power).
A critical mass of fissile material is created when there is enough of the radioactive components and they are sufficiently close to each other that the neutrons generated by the fission of one atom set off a chain reaction by stimulating other atoms to fission. This process generates heat and the neutron flux must be carefully controlled so that the rate of fission does not outpace the ability of the cooling system to remove heat from the reactor core. This is traditionally done by inserting and adjusting control rods of neutron absorbing materials like boron or hafnium. Clearly these reactions need to be contained and not allowed to disperse into the environment. The type of containment depends on the conditions of temperature and pressure inside the reactor but usually comprises a metallic reactor vessel inside a reinforced concrete containment structure.
Cooling/heat transferby water, molten sodium, molten lead, molten fluoride or chloride salts, carbon dioxide or helium gas.
Thermal spectrum reactors with a moderator, such as graphite or water, are the most common. As of April 2020, there are 440 power reactors in the world, operating in the thermal spectrum, with a combined electrical capacity of 390 GW. Additionally, there are 55 reactors under construction and 109 reactors planned, with a combined capacity of 63 GW and 118 GW respectively,
The fast spectrum is currently employed in four active reactors worldwide.
How does a nuclear reactor work? The article “NUCLEAR 101: How Does a Nuclear Reactor Work?” explains in a simplified way how the two most common types, “The Pressurized Light Water Reactor PWR” and the “Boiling Water Reactor BWR”, function.
Pressurized water reactors
Solid fuel, second generation pressurized light water reactors (PWRs), are the most common type of nuclear reactor currently in service and make up two thirds of the US fleet but, whilst they have made a major contribution to carbon free power over the decades, I am convinced that they are not the best option for the future, other than as a short term stop-gap solution.
PWRs were originally designed to be used in submarines for which, being surrounded by emergency coolant, they are ideally suited and they represent a design that dates from the late 1960's. There has been little improvement since then.
Explosion Risks In order to generate high temperature steam at around 300 deg C, PWRs run at a pressure of over 300 bars (atmospheric pressure is equal to one bar) and therefore carry an inherent risk of explosion. To guard against a reactor vessel failure they need thick heavily reinforced concrete containment vessels. They burn enriched uranium fuel which generates waste with very long lived radioactive transuranics and actinides. Also they can only burn 4 or 5% of this fuel before the fuel rods deteriorate and must be replaced. Typically one third of the fuel rods are replaced every two years and kept in storage ponds until they are reprocessed to recover the remaining reusable fuel.
Boiling water reactors
Boiling Water reactors run at lower pressures of 70 -150 bars but are otherwise similar to PWRs in their fuel types and safety issues.
Emergency reactor shutdowns Another major concern with many of the second generation reactor designs currently in service is that, when a reactor shuts down unexpectedly, and there is no power available from the grid, they need backup power supplies in order to run pumps and therefore maintain the cooling needed to remove the heat from the radioactive decay of fission products. This was what failed at Fukushima Daiichi, where the backup generators were in a location which was only designed to resist a 3 metre tsunami and were consequently put out of service.
More recent generation III+ PWR designs currently awaiting approval or under construction do, however, incorporate passive cooling, meaning that once shut down, they don't need power to dissipate decay heat. Other safety features are also included.
Liquid Metal Fast Breeder Reactors
Some types of reactor operating in the fast neutron spectrum, like the liquid metal fast breeder LMFBR, which uses molten sodium as the coolant medium, have other disadvantages. Sodium metal in liquid form is a good coolant, which operates at higher temperatures and lower pressures than water, and is a very good heat transfer material, but it reacts with air, and violently reacts with water. So the possibility of a leak between the liquid sodium and the steam generating sides of the heat exchangers is a serious safety concern. These types of reactors, depending on their size and design, can also have an overall positive temperature coefficient of reactivity, meaning that as the temperature rises, nuclear reactions increase and create more heat.
Such matters can, however, be overcome by good design. The Experimental Breeder Reactor at Argonne (EBR II) included passive safety features and was successfully tested in 1985 under conditions simulating power failure.
Terra Power, a company sponsored by Bill Gates, is proposing a reactor using the fast spectrum, with cooling by molten sodium. The project features a 345 MW sodium-cooled fast reactor with a molten salt-based energy storage system. The storage technology can boost the system’s output to 500 MW of power for more than five and a half hours when needed.
Fast spectrum nuclear reactors can also be designed to breed fissile fuels, such as Plutonium 239 and Uranium 233, from naturally occurring fertile materials like Uranium 238 and Thorium 232. They can also be designed to burn waste from operational reactors using the Uranium/Plutonium fuel cycle.
Service temperatures Reactors currently in service can run at temperatures ranging from 300 deg C for PWRs to 650 deg C for the Advanced Gas Cooled Reactor. The higher the temperature, the more efficiently the power generation system can function.
Much research is being directed to determining the long term resistance of materials to the neutron flux in advanced reactor designs, their limitations, and their suitability under operating conditions of high temperature and pressure.
Nuclear safety Most people object to nuclear power due to safety concerns and the longevity of nuclear waste. Let’s discuss safety first; nuclear waste will be dealt with in part 4 of this series of articles.
In spite of the age of most of the nuclear plants currently in service, on a global scale, there have been very few incidents involving nuclear reactors which have had major consequences, and two of those were at plants with fundamental design flaws.
At Chernobyl, where 64 people died of acute radiation sickness after emergency work, the reactors were never provided with containment vessels and they had other design flaws which would never have been permitted in Western countries.
At Fukushima Daiichi the backup power plant was flooded by the very large tsunami that we tend to forget resulted in over 18,000 people dead or missing. The several dozens of direct casualties at Fukushima are attributed to the effects of the evacuation of the surrounding area on the sick and elderly, but some workers have received radiation doses which exceed lifetime safety limits.
At Three Mile Island operators did not react appropriately when a pilot valve failed and, by sticking open, allowed coolant to escape. This fault had occurred on 11 previous occasions!
Estimates of future deaths related to radiation exposure from these accidental releases of radioactive material vary widely depending on their source, the methods used and the assumptions made. For example for Chernobyl in 2006 the WHO estimate of radiation related premature deaths was 4,000 whereas the Greenpeace estimate was 200,000! In 2008 another WHO report urged caution in the development and use of projections (paragraph 110). The UN Scientific Committee on the Effects of Atomic Radiation makes the following statement in their report revised on 6th April 2021 concerning Chernobyl.
Quote<< Apart from the dramatic increase in thyroid cancer incidence among those exposed at a young age, and some indication of an increased leukaemia and cataract incidence among the workers, there is no clearly demonstrated increase in the incidence of solid cancers or leukaemia due to radiation in the exposed populations. Neither is there any proof of other non-malignant disorders that are related to ionizing radiation. However, there were widespread psychological reactions to the accident, which were due to fear of the radiation, not to the actual radiation doses. >> Unquote
It must be said that this conclusion has been contested by statements made by some of the personnel (called liquidators) involved in the emergency work, the subsequent clean-up and also in various research reports.
Rates for each energy source in deaths per billion kWh produced. Source: Updated (corrected) data from: World Health Organization; CDC; Seth Godin; John Konrad.
In fact you are exposed to less radiation standing next to a nuclear reactor than flying in a plane at 30,000 feet but the specific point I wish to make is that even safer nuclear power options are available than those which are currently in operation.
In the next article, I deal with innovations in nuclear power generation and discuss safer options than the familiar pressurized water reactors that have been in use since the 1960-70’s.


_YB17.png)